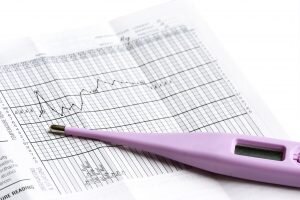
Basal Body Temperature Charting - is your chart a crystal ball?
So, you’re trying to have a baby and decide to start taking your temperature every  morning. This common practice is often used to help understand a woman’s menstrual cycle and has helped many couples successfully conceive (and avoid conception when used in conjunction with other methods!). As someone who frequently works with couples who are trying to conceive, I often rely on temperature charts to help guide our treatment plan, especially when incorporating the principles of Traditional Chinese Medicine.
The Basics
- Basal body temperature charting (BBT) has been around for decades, and used as a method of family planning since the early 1950’s and 60’s. After ovulation, a distinct upwards thermal shift confirms that ovulation has taken place. This is useful information if you’re trying to achieve (or avoid) pregnancy.
- Start by getting a basal body thermometer. These can be found in most drug stores near the family planning section
- Take your temperature every morning, at approximately the same time, before getting out of bed.
- If this varies from day to day by more than 30 mins, you may have difficulty seeing a pattern.
- Note if you are sick, or sleep in beyond your usual wake up time.
- Also take note if you’ve not had at least 3 consecutive hours of sleep as this may affect the accuracy of your temperature reading.
- You can take your temperature orally (by mouth ) or vaginally, but be consistent!
Phases of your Chart
- Follicular Phase: This is the first phase of your cycle leading up to ovulation. Temperatures are lower in this half of your cycle, and may even dip lower just before ovulation. We often use the overall pattern of temperatures in the follicular phase to help determine if a hormone imbalance is present.
- Luteal Phase: This is the second phase of your cycle and is dominated by the hormone progesterone. You temperature should rise within 3 days of ovulation and stay elevated for at least 10 days. Slow rises, or shortened luteal phases may indicate a problem.
What your BBT chart can tell you:
BBT charts are very useful at teaching women about their menstrual cycles, when ovulation is taking place, and the length of both the follicular (1st half) and luteal (2nd half) phases. But, what kind of information can we actually get from a BBT chart?
- Confirm ovulation. Ovulation has taken place once you see 3 days of elevated temperatures over the previous 6 days. This thermal shift indicates the rise in progesterone seen in the luteal phase, or second half of the menstrual cycle.
- While BBT charting alone can’t predict ovulation, using it alongside other fertility indicators such as cervical mucous and position can narrow a woman’s fertile window.
- Length of follicular and luteal phases
- Problems can arrive when either of these are too short (or too long). An example of this would be a luteal phase defect. The luteal phase should be at least 10 days. Anything less than that may indicate a luteal phase defect which can interfere with getting and staying pregnant!
- Low overall temperature. Low temperatures through both phases may suggest a thyroid problem, or other hormone imbalances.
Sometimes, there are patterns that can also suggest pregnancy. A “triphasic pattern” is sometimes seen in early pregnancy, but is no means conclusive.
What your BBT chart can’t tell you:
Your chart isn’t a crystal ball, and no amount of staring at it can tell you if you are pregnant, until AFTER you’ve gotten a positive pregnancy test. It also can’t tell us how you are feeling. So, if you don’t feel well, can’t get pregnant, or have worsening PMS, a BBT chart is just one tool in the toolbox.
